Money
You work until June 9 for the government. In 1961, you were done by May 3.
The average Canadian family now hands over 43 cents of every dollar earned. Six decades of data show the bite keeps growing — mostly in taxes you never vote on.
Published: October 13, 2026 · Updated: October 13, 2026 · 2 min read
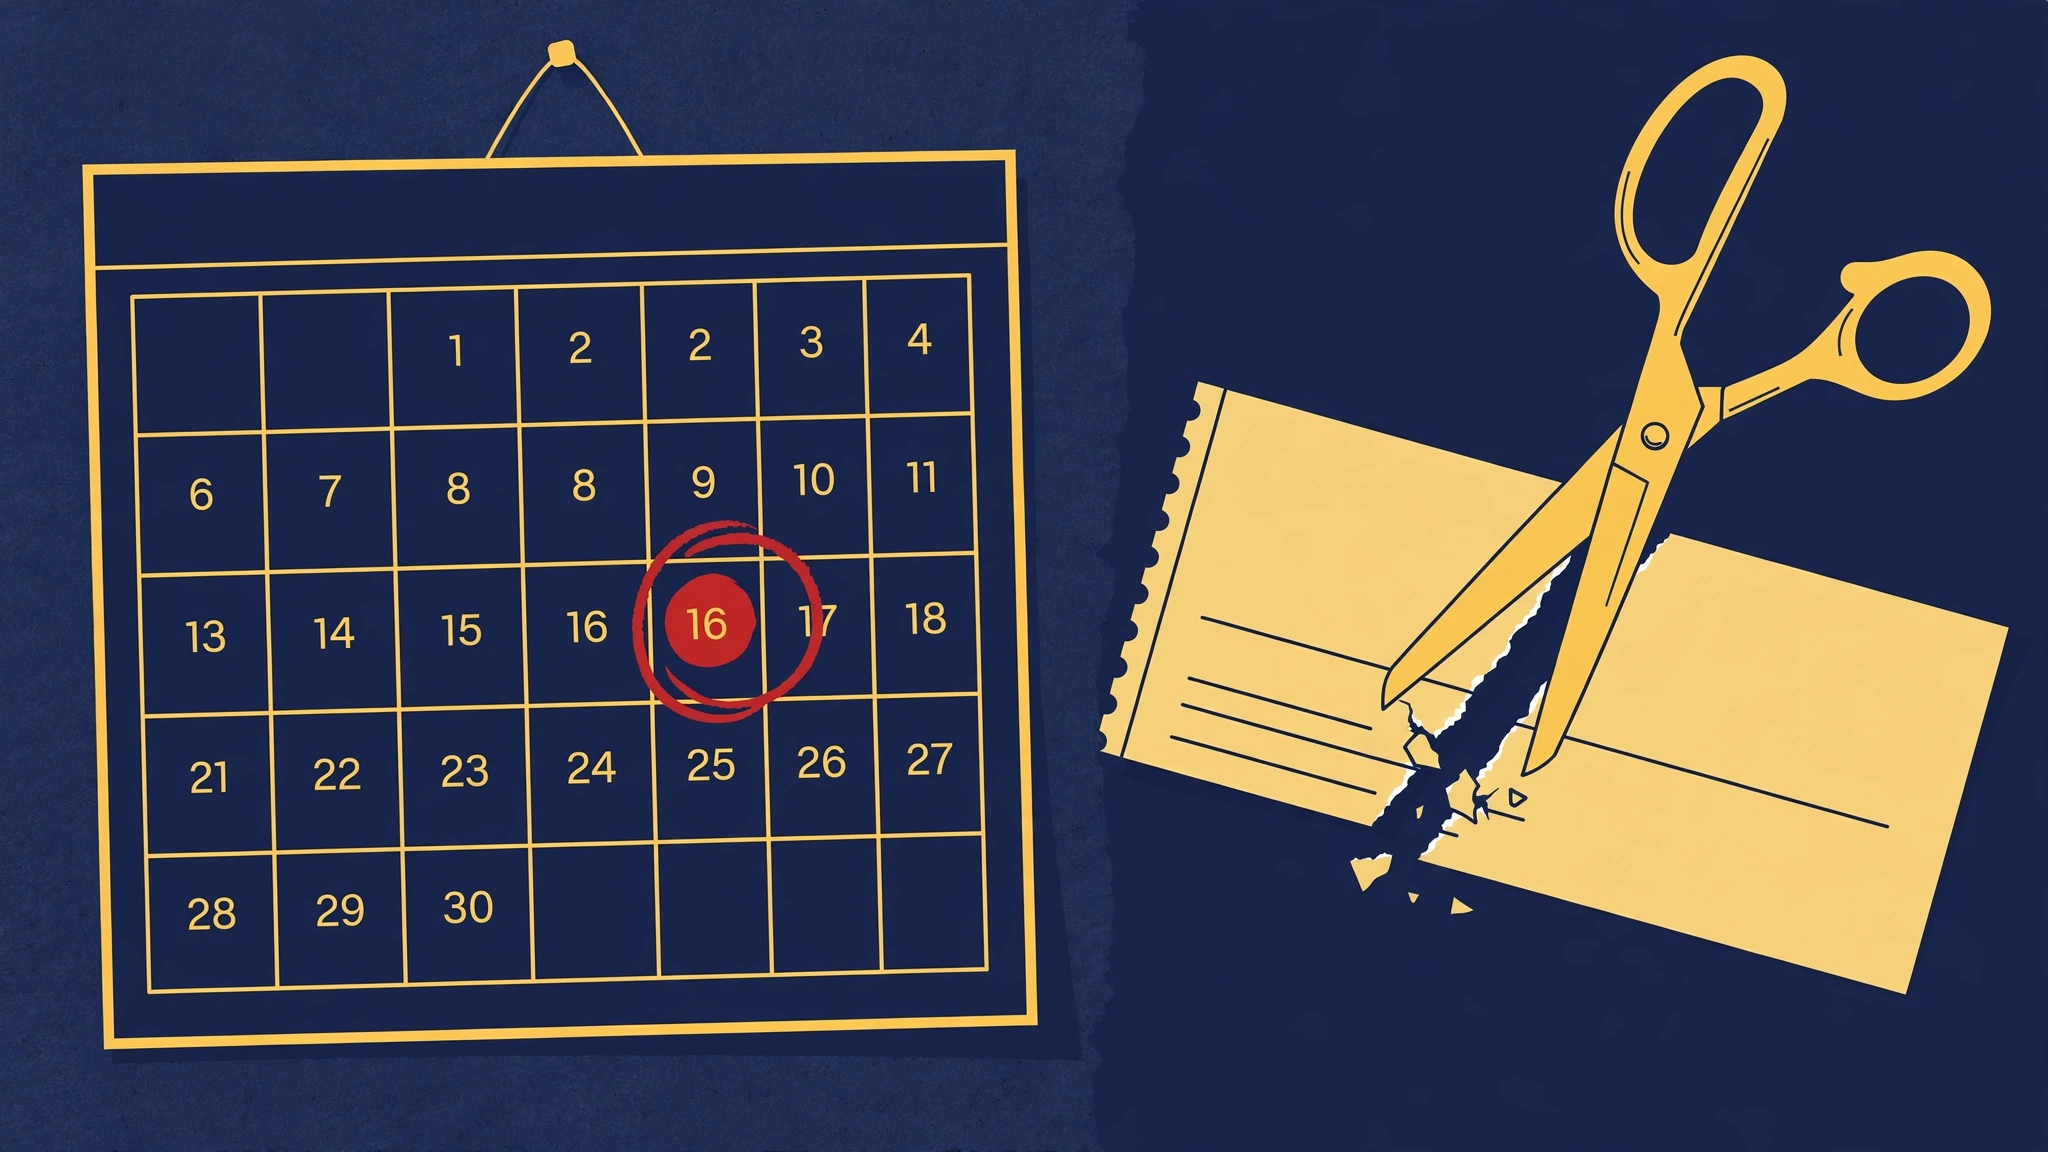
Every June, the Fraser Institute announces the day Canadians "start working for themselves." In 2026, Tax Freedom Day fell on June 9 — meaning the average family spent 160 days, nearly five and a half months, earning enough to pay its total tax bill. In 1961, the day fell on May 3. Your grandparents were done by spring.
The long-run numbers are stark. The Institute's Canadian Consumer Tax Index puts the average family's total tax burden at 33.5 per cent of income in 1961. It peaked at 46.3 per cent in 2000 — the heaviest year on record — dipped to 38.8 per cent in the COVID year of 2020, and stood at 43.0 per cent in 2024. In dollar terms, the average tax bill has risen 2,928 per cent since 1961 — nearly triple the 946 per cent rise in consumer prices over the same period.

Here's the part the income-tax debate misses: personal income tax is less than a third of the bill. Of the average family's $50,721 tax tab in 2025, income taxes were $16,085 — 31.7 per cent. The rest is the quiet accumulation: payroll and health taxes ($11,312), sales taxes ($6,972), property taxes ($4,307), plus profit taxes, fuel and carbon levies, and excise duties. Nobody campaigns on the payroll tax. It just compounds.
And the system is relentlessly progressive at the top. The Institute's 2026 progressivity study finds the bottom fifth of families pay an average total rate of 18.0 per cent; the top fifth pay 55.0 per cent, and the top quintile pays 58.3 per cent of all personal income taxes. Read that however your politics lean — the fact is the same: a small slice of earners carries most of the income-tax load, while everyone feels the sales and payroll taxes on every paycheque and every purchase.
Then there's the tax nobody votes for: bracket creep. Federal brackets are indexed to inflation, but Ontario doesn't index its $150,000 and $220,000 thresholds — earn your way past them through inflation alone and your marginal rate jumps with no vote cast. Ottawa did deliver real relief this year: the lowest federal rate fell to 14 per cent for 2026, and the basic personal amount rose to $16,452. But $75,000 in 2015 is roughly $97,000 in today's dollars — and at that inflation-adjusted income, our calculation shows the average rate barely budged. Statutory cuts; inflation giveth back.
Geography matters enormously. This year's Tax Freedom Days: Saskatchewan May 20, Alberta May 25, Ontario June 8, Nova Scotia June 9, Newfoundland and Labrador June 19 — and Quebec June 27, nearly two months after Saskatchewan. Where you live is a tax policy.
My take: the honest conversation isn't about whether taxes are "high" — it's about visibility. Income tax is salient; the other two-thirds of the bill is designed to be invisible. A country that paid 33.5 per cent in 1961 and pays about 43 per cent now should at least be able to see the whole bill. Start with the payroll line on your pay stub. That's where the century went.
Sources
opinionincome taxtaxesFraser InstituteTax Freedom Daypersonal finance
Newsletter
News. Context. What matters.
One essential briefing, written for people who would rather understand the story than scroll it.
Unsubscribe anytime. We don’t sell addresses.
Recommended
Money
The Bank of Canada decides in four hours. The market says hike — the economy says wait.
At 9:45 a.m. ET the Bank sets its policy rate and publishes new forecasts. Markets lean heavily toward a hike to 2.50%, but the case for holding at 2.25% is real — and a surprise either way moves mortgages, the loonie and December bets.

Money
Amex posted a record quarter — then announced it's cutting 3,500 jobs to get ready for AI
American Express reported record third-quarter revenue of $20.1 billion and raised its profit outlook, then told analysts it will cut about 5 per cent of its workforce in a $336-million restructuring its CFO says is meant "to prepare for AI."
Money
The Bank of Canada is now expected to hike rates on Oct. 28 — and hike again by spring
A Reuters poll of 34 economists finds 56% now expect a quarter-point hike to 2.50% next Wednesday, with another rise by end-March, after September's 3.1% inflation reading and sharply rising expectations.